Ein Bericht von mindestens 150 Wörtern (≈ 20 Min.), der die wichtigsten Merkmale einer Grafik, Tabelle, Karte oder eines Prozesses zusammenfasst und vergleicht.
IELTS AcademicWritingGewicht: Task 2 hat das doppelte Gewicht von Task 1
Ohne klare Overview wird Task Achievement meist bei Band 5 gedeckelt.
Strategie Schritt für Schritt
Gruppieren Sie die Daten nach Trends oder Kategorien, statt Zeile für Zeile zu beschreiben.
Nennen Sie konkrete Zahlen, um jedes erwähnte Merkmal zu belegen.
Typische Fallen
Meinungen oder Ursachen anführen (sie sind nicht verlangt).
„percentage points“ mit „per cent“ verwechseln.
Gelöstes Beispiel
„Overall, older people spent far more time watching TV and reading, whereas younger people favoured social media and exercise.“
Beispielfragen
Versuche zu antworten, bevor du die Lösung öffnest. Die Fragen sind in der Prüfungssprache.
Frage 1
Schwierigkeit: mittel≈ 20 min
Writing Task 1. You should spend about 20 minutes on this task.
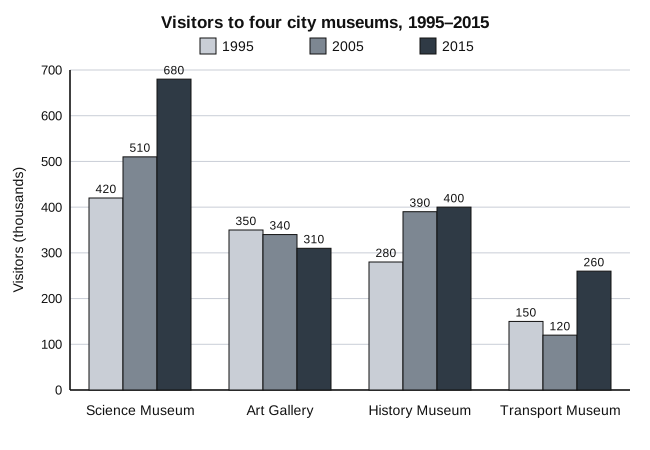
The bar chart below shows the number of visitors to four museums in one city in 1995, 2005 and 2015.
Summarise the information by selecting and reporting the main features, and make comparisons where relevant.
Write at least 150 words.
150–220 Wörter · 20 min.
Musterlösung und Kriterien anzeigen
Musterantwort
The bar chart illustrates how many people visited four museums in one city in 1995, 2005 and 2015.
Overall, total visitor numbers rose over the period, and the Science Museum was the most popular attraction in all three years. The Art Gallery was the only museum whose attendance fell over the twenty years as a whole.
The Science Museum saw the largest growth, with visitors increasing from 420,000 in 1995 to 510,000 in 2005 and then to 680,000 in 2015. The History Museum also became more popular, rising from 280,000 to 390,000 in the first decade, although it gained only a further 10,000 visitors in the second.
The other two museums followed different patterns. The Art Gallery attracted 350,000 visitors in 1995, but this figure declined slightly to 340,000 and then to 310,000. The Transport Museum, the least visited of the four in every year, dipped from 150,000 to 120,000 in 2005 before more than doubling to 260,000 in 2015.
As a result, the combined number of visitors to the four museums grew from 1.2 million to 1.65 million.
Bewertungskriterien
Task Achievement: covers the requirements; gives a clear overview of the main trends or differences; highlights and illustrates key features with accurate figures; reports only what the data show (no opinions or causes)
Coherence and Cohesion: organises information logically (introduction, overview, 2 body paragraphs); uses a range of linking devices accurately; clear paragraphing
Lexical Resource: varied, precise vocabulary for describing and comparing data (rose, declined slightly, more than doubled, the proportion of...); accurate spelling and word formation
Grammatical Range and Accuracy: mix of simple and complex sentences (comparatives, relative clauses, while/whereas); most sentences error-free
Length and time: at least 150 words in about 20 minutes; do not copy the wording of the task
Erklärung
With a bar chart over several years, describe trends (rose, dipped, more than doubled) rather than isolated numbers, and remember the figures are in thousands (420 = 420,000). A good overview mentions the overall increase, the leader (Science Museum) and the exception (Art Gallery). Grouping rising museums in one paragraph and the others in another keeps the report coherent.
Frage 2
Schwierigkeit: mittel≈ 20 min
Writing Task 1. You should spend about 20 minutes on this task.
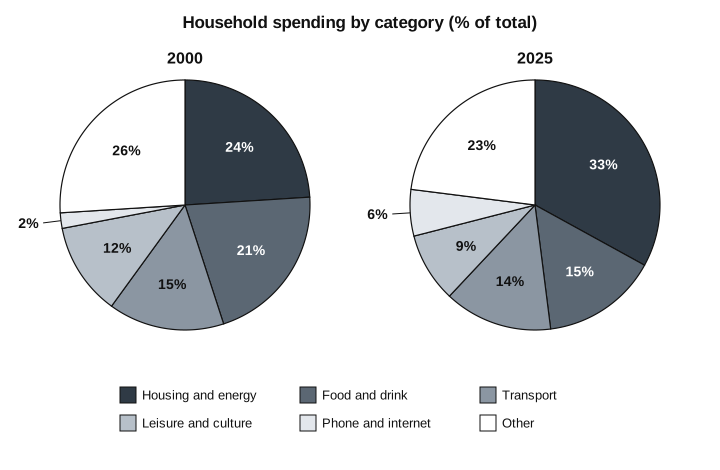
The pie charts below show how households in one country divided their spending between six categories in 2000 and 2025.
Summarise the information by selecting and reporting the main features, and make comparisons where relevant.
Write at least 150 words.
150–220 Wörter · 20 min.
Musterlösung und Kriterien anzeigen
Musterantwort
The two pie charts compare the proportion of household spending that went on six categories in one country in 2000 and 2025.
Overall, the most significant change was the growing share taken by housing and energy, which became by far the largest single category. Over the same period, the proportion spent on food and drink and on leisure fell, while spending on phones and the internet, although still small, tripled.
In 2000, housing and energy accounted for almost a quarter of household budgets (24%), only slightly more than food and drink (21%). By 2025, however, the figure for housing had risen to a third, whereas the share devoted to food and drink had dropped to 15%. Leisure and culture also declined, from 12% to 9%.
The remaining categories changed less. Transport remained almost stable, falling by just one percentage point to 14%, and 'other' spending decreased modestly from 26% to 23%. The only category apart from housing to grow was phone and internet services, which rose from a mere 2% of spending to 6%.
Bewertungskriterien
Task Achievement: covers the requirements; gives a clear overview of the main trends or differences; highlights and illustrates key features with accurate figures; reports only what the data show (no opinions or causes)
Coherence and Cohesion: organises information logically (introduction, overview, 2 body paragraphs); uses a range of linking devices accurately; clear paragraphing
Lexical Resource: varied, precise vocabulary for describing and comparing data (rose, declined slightly, more than doubled, the proportion of...); accurate spelling and word formation
Grammatical Range and Accuracy: mix of simple and complex sentences (comparatives, relative clauses, while/whereas); most sentences error-free
Length and time: at least 150 words in about 20 minutes; do not copy the wording of the task
Erklärung
Two pie charts with six categories: group them by direction of change (up: housing, phone/internet; down: food, leisure; little change: transport, other) instead of listing every row. The overview must name the biggest change (housing becomes by far the largest share). Write about percentages ('share', 'proportion', 'percentage points'), not amounts of money, and do not give reasons such as rising rents.
Frage 3
Schwierigkeit: schwer≈ 20 min
Writing Task 1. You should spend about 20 minutes on this task.
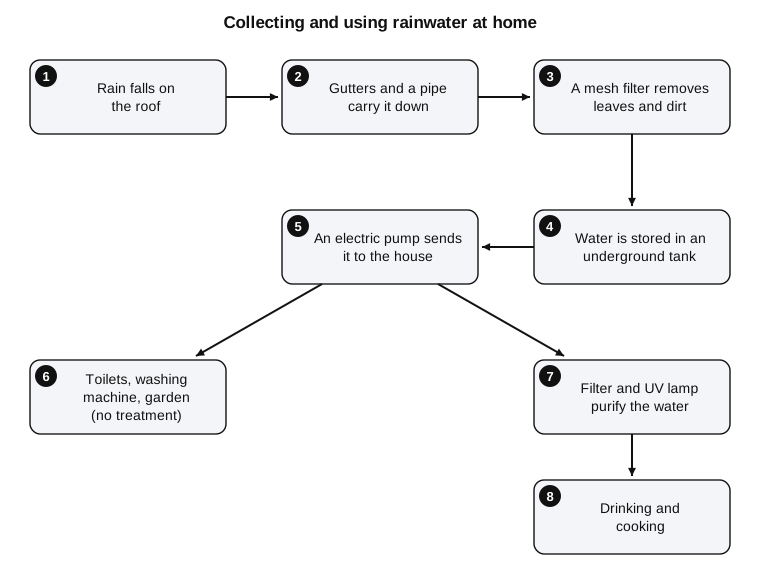
The diagram below shows how rainwater is collected and used in a house.
Summarise the information by selecting and reporting the main features, and make comparisons where relevant.
Write at least 150 words.
150–220 Wörter · 20 min.
Musterlösung und Kriterien anzeigen
Musterantwort
The diagram illustrates the stages by which rainwater is collected at a house and then supplied for different household uses.
Overall, the process consists of eight steps, beginning with rain falling on the roof and ending with the water being used in the home. The key feature is that the water divides into two streams after it is pumped: only the water intended for drinking and cooking is purified.
In the first stage, rain lands on the roof and is channelled down by gutters and a pipe. It then passes through a mesh filter, which removes leaves and dirt, before being stored in an underground tank. From the tank, an electric pump sends the water up to the house.
At this point, the supply is split. Some of the water goes directly, without any treatment, to the toilets, the washing machine and the garden. The rest is first purified by a second filter and a UV lamp, after which it is safe to be used for drinking and cooking.
Bewertungskriterien
Task Achievement: covers the requirements; gives a clear overview of the main trends or differences; highlights and illustrates key features with accurate figures; reports only what the data show (no opinions or causes)
Coherence and Cohesion: organises information logically (introduction, overview, 2 body paragraphs); uses a range of linking devices accurately; clear paragraphing
Lexical Resource: varied, precise vocabulary for describing and comparing data (rose, declined slightly, more than doubled, the proportion of...); accurate spelling and word formation
Grammatical Range and Accuracy: mix of simple and complex sentences (comparatives, relative clauses, while/whereas); most sentences error-free
Length and time: at least 150 words in about 20 minutes; do not copy the wording of the task
Erklärung
A process has no numbers to compare, so the overview must say how many stages there are, where the process starts and ends, and its most important feature (here, the split into treated and untreated water). Use the passive ('is channelled', 'is stored', 'is purified') and sequencing language ('In the first stage', 'then', 'before being', 'after which'). Do not invent purposes or details that are not in the diagram.