Versuche zu antworten, bevor du die Lösung öffnest. Die Fragen sind in der Prüfungssprache.
Frage 1
Schwierigkeit: leicht≈ 1 min
Passage III — Lichens and distance from a highway (data representation)
Lichens are organisms made up of a fungus and an alga living together. Many lichens are sensitive to air pollution, especially nitrogen dioxide (NO2), a gas released by vehicle engines. Scientists studied tree trunks at several distances from a busy highway. At each distance, they measured the average NO2 concentration in the air, in parts per billion (ppb), and the percent of each tree trunk’s surface covered by 2 types of lichen: leafy lichens and crusty lichens. Table 1 shows the averages for each distance.
Table 1
Distance from highway (m)
NO2 (ppb)
Leafy lichen cover (%)
Crusty lichen cover (%)
10
42
2
31
50
33
6
28
100
25
13
24
200
18
24
19
400
12
37
15
800
9
45
13
Based on Table 1, as distance from the highway increased, leafy lichen cover:
AA. decreased only.
BB. increased and then decreased.
CC. decreased and then increased.
DD. increased only.
Antwort und Erklärung anzeigen
Richtige Antwort: D. increased only.
Erklärung
Leafy lichen cover rose from 2% to 6, 13, 24, 37, and 45% as distance increased: it increased only.
Frage 2
Schwierigkeit: mittel≈ 1 min
Passage VII — Solubility of 3 salts (research summary)
The solubility of a substance is the greatest mass of it that can dissolve in a given amount of water at a given temperature. A solution that holds that greatest mass is saturated.
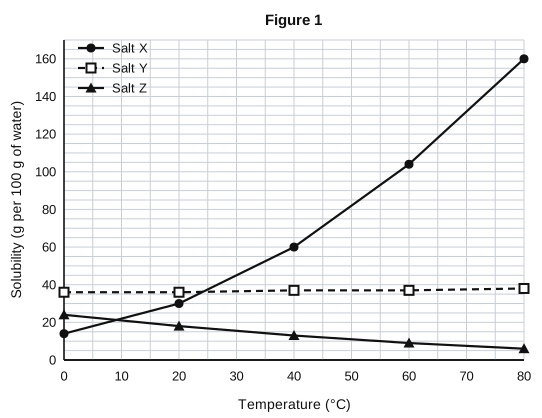
Students measured the solubility of 3 salts (Salts X, Y, and Z) in 100 g of water at 5 temperatures. At each temperature, they added a salt to the water in small portions, stirring for 5 minutes after each addition, until some of the salt remained undissolved. They then filtered the mixture, dried and weighed the undissolved salt, and subtracted that mass from the total mass of salt added. The results are shown in Figure 1.
Based on Figure 1, Salts X and Y had the same solubility at a temperature closest to:
AA. 10°C
BB. 25°C
CC. 40°C
DD. 60°C
Antwort und Erklärung anzeigen
Richtige Antwort: B. 25°C
Erklärung
Salt Y stays near 36 g. Salt X is 30 g at 20°C and 60 g at 40°C, so it passes 36 g a little above 20°C, at about 24°C. The closest choice is 25°C.
Near 10°C it is Salts X and Z whose lines cross. At 40°C and 60°C, Salt X is far above Salt Y.
Frage 3
Schwierigkeit: schwer≈ 1 min
Passage V — City noise and bird song (data representation)
Male songbirds sing to defend their territories and to attract mates. Traffic noise is mostly low-pitched, so it easily masks (drowns out) the low-pitched parts of a song.
Researchers studied a songbird species that lives in forests, suburbs, and city centers. For each of 12 males, they measured the background noise level in the male’s territory, in decibels (dB), and the lowest frequency in the male’s song, in kilohertz (kHz). A higher frequency is a higher pitch. Figure 1 shows the results, with a line of best fit. Figure 2 shows the average background noise in each of the 3 habitats at dawn and at noon.
Based on Figures 1 and 2, a male singing at noon in the Downtown habitat would be expected to have a lowest song frequency closest to:
AA. 2.7 kHz
BB. 3.1 kHz
CC. 3.4 kHz
DD. 3.7 kHz
Antwort und Erklärung anzeigen
Richtige Antwort: C. 3.4 kHz
Erklärung
Figure 2: Downtown at noon averages about 68 dB. Figure 1: the line of best fit at 68 dB is at about 3.4 kHz.
3.1 kHz is the value for Downtown at DAWN (about 58 dB). 2.7 kHz matches the forest (about 40–42 dB). 3.7 kHz is above the line anywhere on the graph.