SAT · Math · Advanced Math
Nonlinear functions
Funciones cuadráticas y exponenciales: evaluarlas, encontrar máximos o mínimos, traslaciones e interpretar tasas de crecimiento.
Digital SATMathPeso: ≈35 % · 13–15 preguntas
Claves
- Vértice de ax2+bx+c en x=−2ab; en a(x−h)2+k el vértice es (h,k).
- Exponencial a⋅bt: b>1 crece un (b−1)⋅100 %; b<1 decrece un (1−b)⋅100 %.
- f(x−3) desplaza la gráfica 3 unidades a la DERECHA.
Estrategia paso a paso
- Reescribe exponentes como 2t para ver la tasa anual: 1,21t/2=1,1t (sube un 10 % al año).
Trampas habituales
- Confundir el valor máximo con la x donde se alcanza.
Ejemplo resuelto
f(x)=−(x−4)2+9: el vértice es (4,9), así que el valor máximo es 9 (y se alcanza en x=4).
Preguntas de ejemplo
Intenta responder antes de abrir la solución. Las preguntas están en el idioma del examen.
Pregunta 1
Dificultad: fácil≈ 1 min
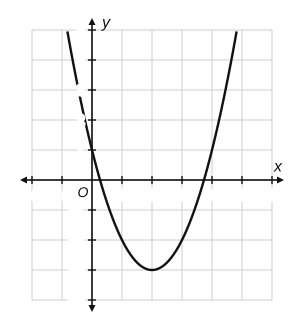
The graph of y=f(x) is shown. What is the minimum value of f(x)?
Respuesta numérica (escribes el número).
Ver respuesta y explicación
Respuesta: -3
Explicación
The minimum value of f(x) is the y-coordinate of the lowest point of the graph. The lowest point (the vertex) is (2,−3), so the minimum value is −3.
2 is the x-value where the minimum occurs, not the minimum value itself.
Pregunta 2
Dificultad: media≈ 1 min
For f(x)=2⋅4x, evaluate f(3).
- AA. 24
- BB. 32
- CC. 128
- DD. 512
Ver respuesta y explicación
Respuesta correcta: C. 128
Explicación
f(3)=2⋅43=2⋅64=128.
24 multiplies 2⋅4⋅3, 32 uses 42 instead of 43, and 512 is 83, which multiplies 2 and 4 before raising to the power.
Pregunta 3
Dificultad: difícil≈ 2 min
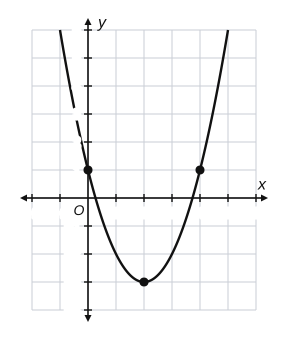
The parabola shown is the graph of a quadratic function f. Find f(7).
Respuesta numérica (escribes el número).
Ver respuesta y explicación
Respuesta: 22
Explicación
The vertex is (2,−3), so f(x)=a(x−2)2−3. The graph passes through (0,1): 1=a(4)−3, so a=1 and f(x)=(x−2)2−3. Then f(7)=52−3=22.
Check with (4,1): (2)2−3=1.
Sigue practicando
Otras destrezas de Math
Estructura completa del examen SAT · Todas las guías