Test each model with two or three points from the table.
Common traps
Interpreting the slope as if it were the starting value.
Worked example
Line of best fit y=3x+2: for x=4 it predicts 14. If the actual value is 15, the residual is 15−14=1.
Sample questions
Try to answer before opening the solution.
Question 1
Difficulty: easy≈ 1 min
A line of best fit for a scatterplot of y versus x has equation y=2.5x+14. What is the predicted value of y when x=8?
Numeric answer (you type the number).
Show answer and explanation
Answer: 34
Explanation
Substitute x=8: y=2.5(8)+14=20+14=34.
The line gives a prediction; actual data points may differ.
Question 2
Difficulty: medium≈ 1 min
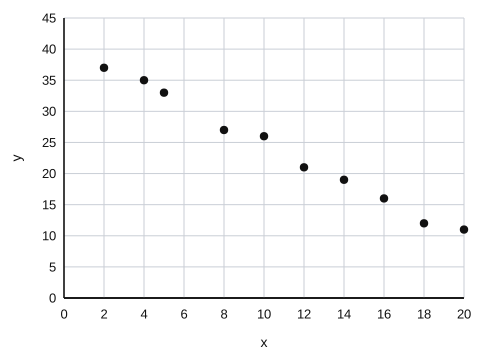
Which of the following equations best models the data in the scatterplot?
AA. y=1.5x+40
BB. y=−0.2x+40
CC. y=−1.5x+10
DD. y=−1.5x+40
Show answer and explanation
Correct answer: D. y=−1.5x+40
Explanation
The points fall from left to right, so the slope is negative. Moving from about (2,37) to (20,11), y decreases about 26 while x increases 18, a slope of about −1.4. Extending the trend back to x=0 gives a y-intercept near 40. So y=−1.5x+40 fits best.
y=1.5x+40 rises instead of falling. y=−1.5x+10 has a y-intercept far below the data. y=−0.2x+40 is much too flat: at x=20 it gives 36, not about 11.
Question 3
Difficulty: hard≈ 2 min
x
y
1
6
3
24
5
96
7
384
The table shows four pairs of values of x and y. Which of the following equations models the relationship between x and y exactly for all four pairs?
AA. y=3(2)x
BB. y=3(4)x
CC. y=6(2)x
DD. y=6(4)x
Show answer and explanation
Correct answer: A. y=3(2)x
Explanation
Each time x increases by 2, y is multiplied by 4 (6→24→96→384). So when x increases by 1, y is multiplied by 4=2, and the model has the form y=a(2)x. Using (1,6): 6=a(2)1, so a=3 and y=3(2)x. Check: 3(2)7=3(128)=384.
y=3(4)x and y=6(4)x treat 4 as the growth factor for each increase of 1 in x. y=6(2)x uses the first y-value as if it occurred at x=0.